A marketing attribution model comparison shows how different credit rules change which channels appear to create leads, pipeline and revenue. Start with first touch and last touch, add a transparent multi-touch baseline and compare those views with the data-driven reporting your platforms can support.
The choice isn't just statistical. If the same deal credits paid search under last touch and organic search under first touch, a budget meeting can reach opposite conclusions without any change in customer behavior. The useful question's which decision the model can support, given the interactions your stack can actually observe.
- First touch answers where a recorded journey began; last touch answers which recorded interaction preceded conversion.
- Linear, time decay, U-shaped and W-shaped models redistribute the same credit using explicit assumptions.
- GA4 and Google Ads no longer offer first click, linear, time decay or position-based models as native attribution choices.
- Use one conversion definition, one lookback window and one deduplicated journey set when comparing models.
- Treat attribution as an allocation lens, not proof that a channel caused a sale.
Which marketing attribution models should you compare?#
Marketing teams should compare first touch, last touch, linear, time decay, U-shaped, W-shaped and data-driven attribution. The first six use understandable rules; data-driven methods estimate credit from observed paths. Each answers a different operating question, and none can recover interactions that weren't captured.
| Marketing attribution model | Credit rule | Useful decision | Main blind spot |
|---|---|---|---|
| First touch | 100% to the first recorded eligible touch | Which channels introduce accounts? | Nurture and closing work disappears |
| Last touch | 100% to the last eligible touch | Which interactions precede conversion? | Early demand creation disappears |
| Linear | Equal share for each eligible touch | Which channels participate across a journey? | A casual visit counts like a high-intent action |
| Time decay | More credit to recent touches | Which recent interactions support a conversion? | Older demand creation receives less weight |
| U-shaped | 40% first, 40% lead creation, 20% to other touches in this example | Which channels introduce and capture leads? | Later opportunity work receives little credit |
| W-shaped | 30% first, 30% lead creation, 30% deal creation, 10% to other touches | Which channels support pipeline milestones? | Requires consistent CRM milestones |
| Data-driven | Weights estimated from observed paths | How does observed interaction contribution vary? | Coverage and model logic may be opaque |
What does first-touch attribution measure?#
First-touch attribution gives the first recorded eligible interaction all the credit. It's useful when marketing operations needs to assess discovery channels, but the first recorded event isn't necessarily the buyer's first exposure to the brand.
A buyer might hear a podcast, later search for the company and then fill out a form. If the podcast interaction isn't tracked, organic search may look like the origin. Keep that distinction visible in reports and don't call first touch a causal estimate of awareness.
What does last-touch attribution measure?#
Last-touch attribution gives the last eligible interaction all the credit. It's a clean view of conversion-adjacent activity, but it can reward branded search, email or retargeting that benefited from earlier campaigns.
Define whether last touch means the last recorded interaction, last non-direct interaction or last eligible paid ad. Those aren't interchangeable. Google Analytics' paid and organic last-click model ignores direct traffic unless the journey contains only direct visits.
When are linear and time-decay models useful?#
Linear attribution divides credit equally across eligible touches. It's a transparent neutral comparison, not a claim that every touch contributed equally. Use it to see which channels vanish under single-touch reporting.
Time-decay attribution assigns larger weights to recent interactions. A seven-day half-life means a touch seven days earlier gets half the raw weight of an otherwise equivalent touch on conversion day. The chosen half-life's a policy assumption, so publish it alongside the result.
What's the difference between U-shaped and W-shaped attribution?#
U-shaped attribution emphasizes first interaction and lead creation. W-shaped attribution adds deal creation as a third milestone, which makes it more useful for B2B pipeline analysis when CRM dates and associations are reliable.
The names aren't a universal specification. Some guides define U-shaped as first and last interaction, while HubSpot defines it around first interaction and lead conversion. The comparison here uses HubSpot's documented milestone definitions. Don't compare two dashboards labeled U-shaped without checking their event rules.
How does one conversion change under six attribution models?#
One four-touch journey produces sharply different channel credits under six attribution models, even though the conversion and its value don't change. The example uses a hypothetical $20,000 opportunity and four eligible interactions with clean timestamps and a consistent account ID.
The journey starts with organic search on day minus 28, paid social on day minus 14, a webinar that creates a lead on day minus 7 and paid search that creates the opportunity on day zero. For this example, the opportunity creation's the conversion, not a closed-won sale.
| Marketing attribution model | Organic search (%) | Paid social (%) | Webinar (%) | Paid search (%) |
|---|---|---|---|---|
| First touch | 100 | 0 | 0 | 0 |
| Last touch | 0 | 0 | 0 | 100 |
| Linear | 25 | 25 | 25 | 25 |
| Time decay, seven-day half-life | 3.45 | 13.79 | 27.59 | 55.17 |
| U-shaped, first and lead create | 40 | 10 | 40 | 10 |
| W-shaped, first, lead and deal create | 30 | 10 | 30 | 30 |
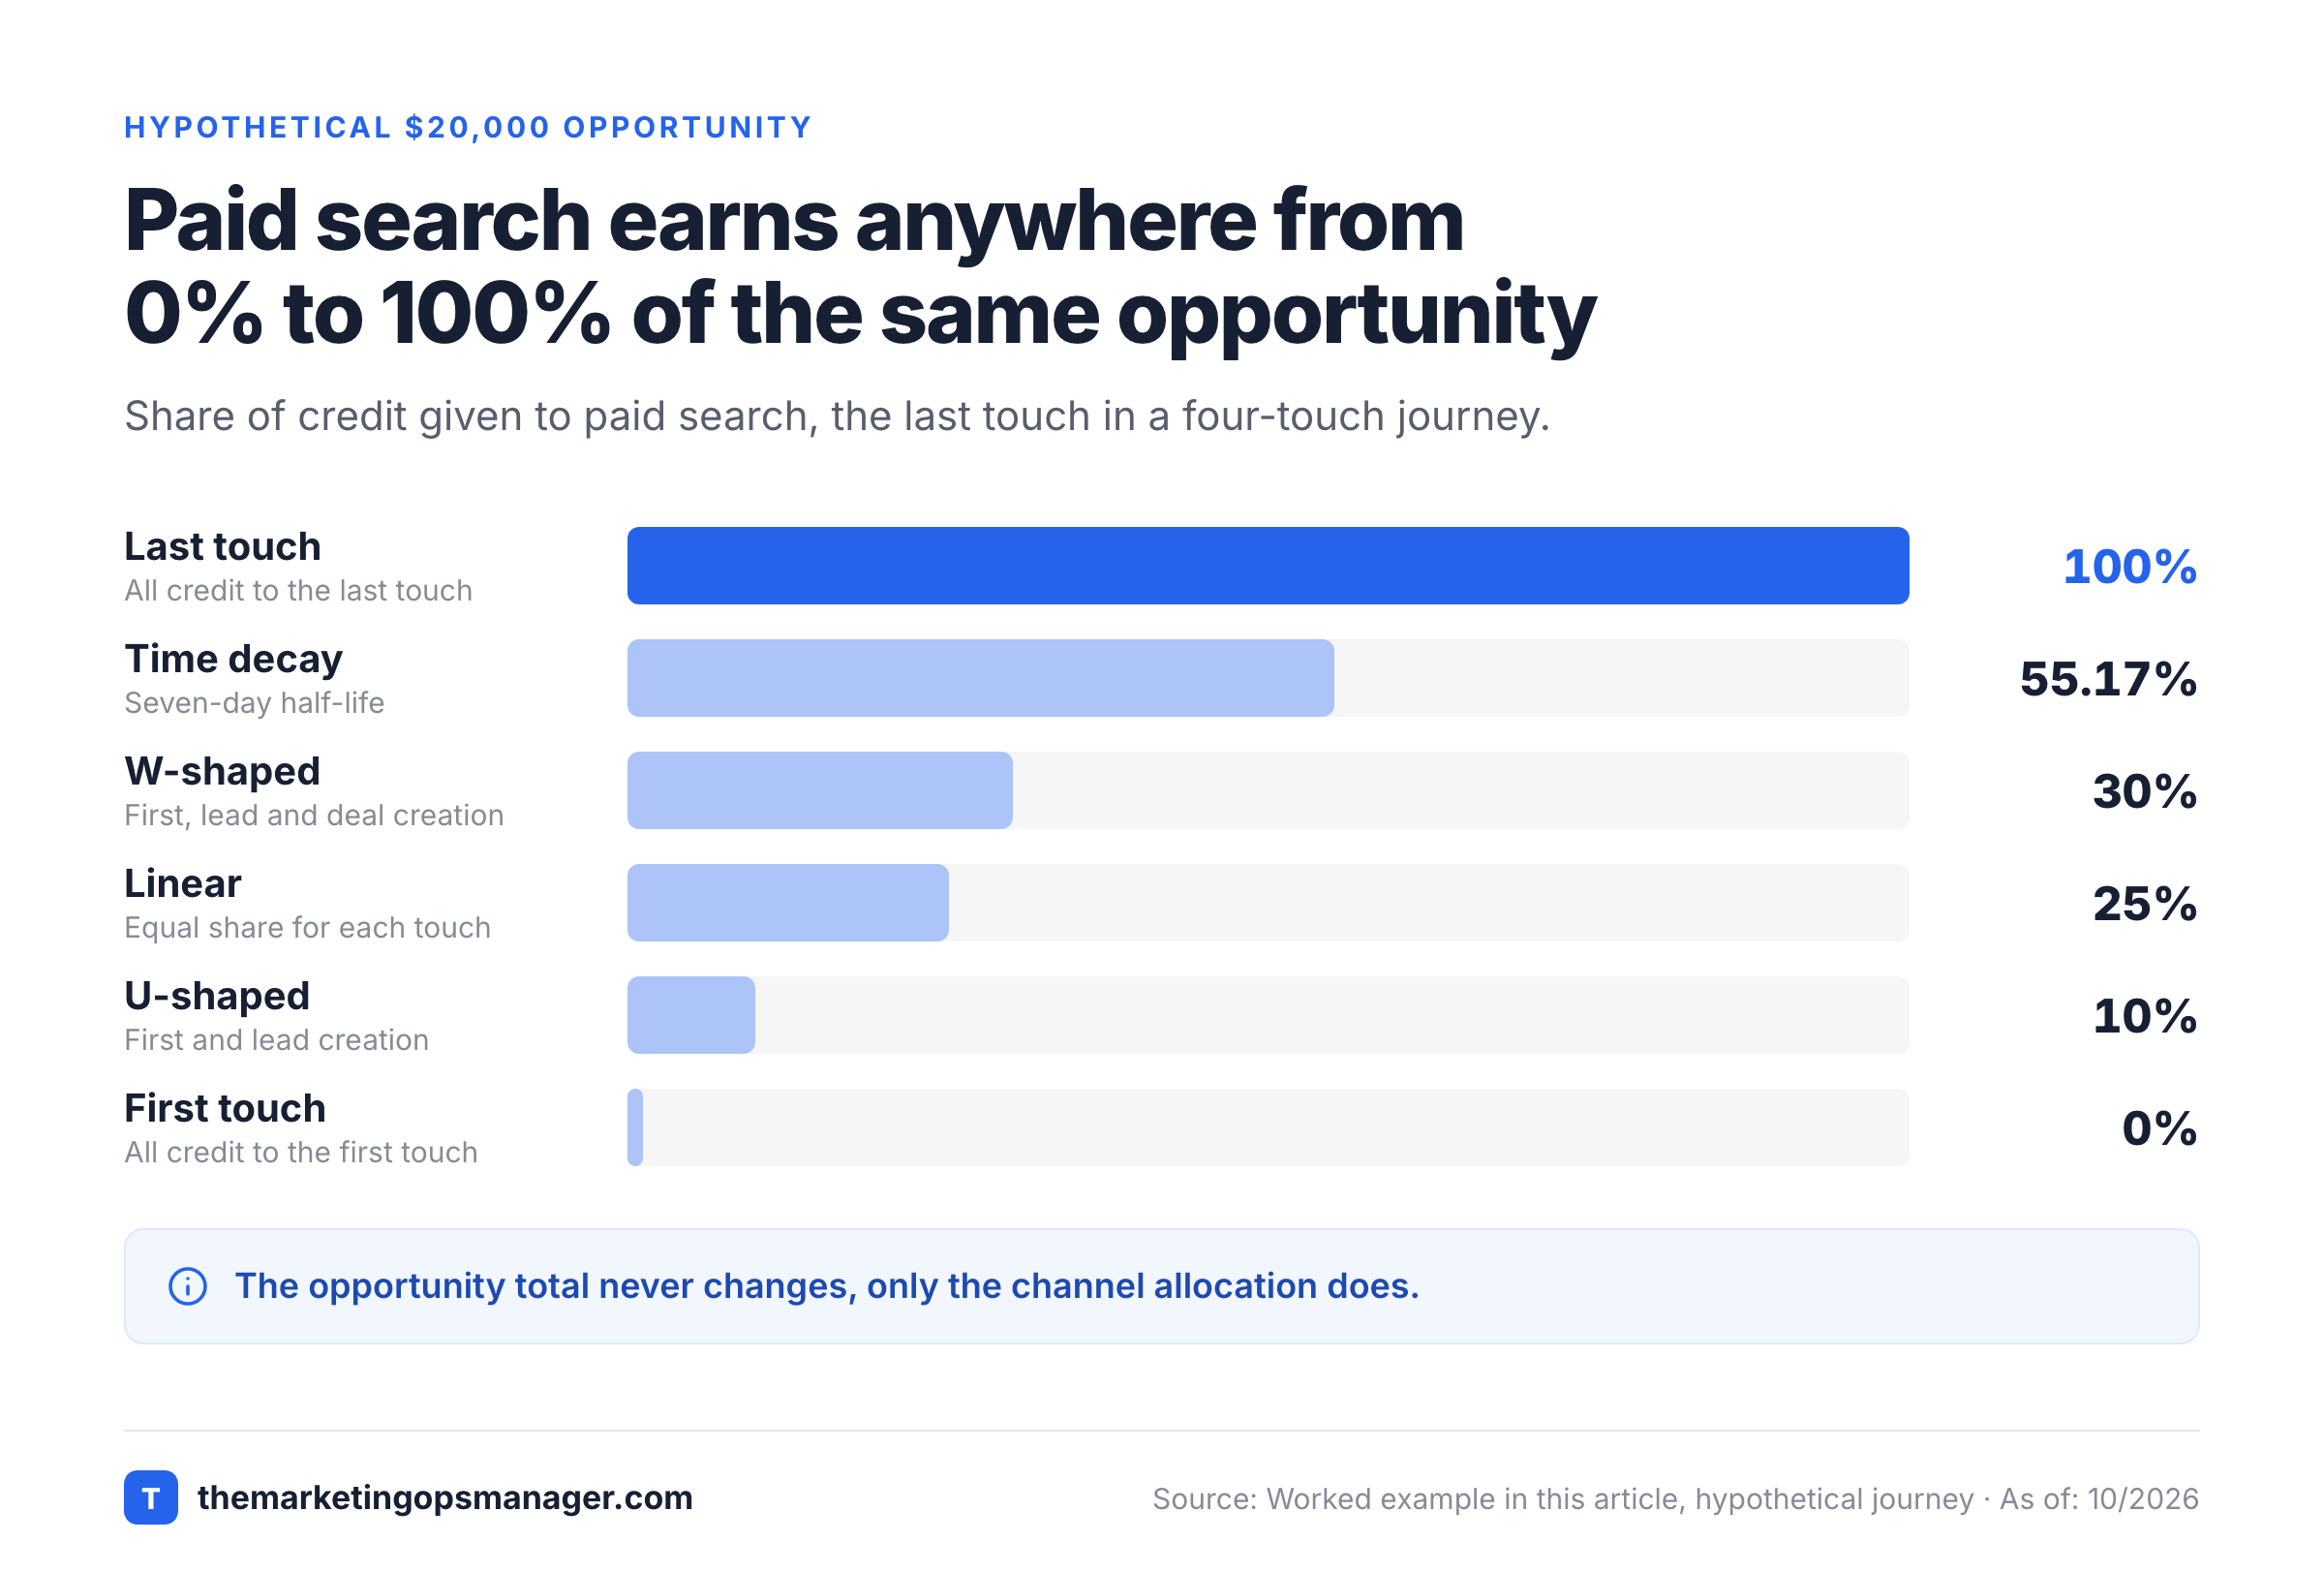
The time-decay row uses weights of 0.0625, 0.25, 0.5 and 1, divided by their total of 1.8125. The percentages are rounded, so the displayed row sums to 100. The U-shaped row divides the remaining 20% between paid social and paid search. The W-shaped row assigns the remaining 10% to paid social.
Under last touch, paid search receives the entire hypothetical $20,000 opportunity credit. Under U-shaped attribution it receives $2,000, while organic search receives $8,000. Under W-shaped attribution each of organic search, webinar and paid search receives $6,000. These are allocations of the same opportunity, not three separate opportunities or additional revenue.
Why do the totals remain equal?#
The totals remain equal because each rule redistributes one conversion's credit. The denominator stays the same eligible journey and the same conversion value, so model selection changes the channel allocation, not the booked amount.
In a real dataset, differences in conversion scope, identity stitching, lookback rules and eligibility can change the denominator too. Fix those differences before you're tempted to blame the model itself.
How should marketing ops handle repeated touches?#
Marketing ops should define whether repeated touches are separate interactions or collapsed into a single channel-stage event. A linear model with ten email clicks and one webinar visit will heavily favor email if each click counts independently.
Write down the deduplication rule you've chosen. For a campaign planning view, one eligible interaction per channel per defined time period may be easier to explain. For an engagement analysis, individual touches may be appropriate. Neither rule should be silently changed between reports.
Which attribution model fits your buying cycle and decision?#
The best marketing attribution model depends on the decision, the conversion milestone and the quality of your path data. Use last touch for conversion-adjacent diagnostics, first touch for recorded acquisition, linear as a baseline and milestone models when the CRM can reliably identify lead and opportunity creation.
| Decision to make | Primary comparison | Evidence needed | Caution |
|---|---|---|---|
| Which channels introduce net-new accounts? | First touch versus last touch | Reliable first recorded touch and account identity | Unknown pre-tracking exposure |
| Which campaigns influence demo requests? | Last touch versus linear | Consistent demo key event and UTMs | Form failures distort channel mix |
| Which activities support lead capture? | U-shaped versus linear | Stable lead creation timestamp | Definition of lead must be fixed |
| Which campaigns contribute to opportunity creation? | W-shaped versus last touch | CRM opportunity IDs and contact associations | Multi-contact account journeys |
| Which paid interactions appear to contribute? | Platform data-driven versus last click | Platform-eligible paths and conversion action | Not a full cross-platform causal estimate |
| Should we cut a channel budget? | Attribution plus incrementality test | Spend, holdout design and revenue outcomes | Attribution alone isn't enough |
What should a small marketing team use first?#
A small marketing team should start with one trustworthy conversion definition, a last-touch baseline and a first-touch comparison. Add linear only once you're able to reconstruct eligible journeys consistently.
It's tempting to implement W-shaped attribution because a board deck needs pipeline credit. If your CRM creates opportunities days after the real decision or loses contact-to-deal links, the extra precision's cosmetic. Fix those handoffs before weighting milestones.
What should a B2B revenue team use for pipeline?#
A B2B revenue team can use W-shaped attribution as a documented planning lens when first interaction, lead creation and deal creation are reliable. Pair it with last touch and a source-of-truth pipeline report, not a separate count of opportunities.
For buying committees, decide whether the unit's person, account or opportunity. A single account may have several contacts who attend different webinars. An opportunity-level rollup needs deterministic association rules and a clear policy for credit that spans contacts.
What should a paid acquisition team use for bidding?#
A paid acquisition team should use the attribution choices supported by its ad platform for conversion optimization, then compare the result with independent revenue reporting. Don't try to force a spreadsheet U-shaped model into an ad account's bidding settings when the platform no longer supports it.
Google Ads supports last click and data-driven attribution for conversion actions, with data-driven the default for most actions. Platform reporting only reflects eligible interactions under the platform's own measurement rules. It can't substitute for a reconciled view of all marketing and sales activity.
Which attribution models can GA4 and Google Ads actually run in 2026?#
GA4 attribution reports currently provide data-driven, paid and organic last click and Google paid channels last click. Google Ads offers last click and data-driven attribution. First click, linear, time decay and position-based models were removed from Google's native choices, so historical comparison templates shouldn't be mistaken for current configuration options.
| Reporting system | Supported attribution choice | What it measures | Operational implication |
|---|---|---|---|
| GA4 attribution reports | Data-driven | Fractional credit based on observed path data | Expect decimals in attributed key events |
| GA4 attribution reports | Paid and organic last click | Last eligible non-direct channel across paid and organic | Good transparent counterpoint |
| GA4 attribution reports | Google paid channels last click | Last eligible Google paid channel | Narrower credit scope |
| Google Ads conversion actions | Data-driven or last click | Eligible Google Ads interactions | Don't equate with all-channel revenue |
| External warehouse or spreadsheet | First, last, linear, time decay, U-shaped or W-shaped as defined by your team | Your joined eligible events | Requires owned identity, event and milestone logic |
How do GA4 reporting attribution settings affect historical reports?#
GA4 reporting attribution model changes apply to historical and future data. They affect key event reporting with event-scoped traffic dimensions, while first-user and session-scoped dimensions aren't changed by that setting.
The lookback window behaves differently: Google says lookback changes apply going forward. For acquisition key events such as first_visit, the default is 30 days with a seven-day option. Other key events default to 90 days, with 30-day and 60-day options. Log the selected window before comparing periods.
Why don't GA4 and Google Ads totals always match?#
GA4 and Google Ads totals can differ because channel eligibility, conversion definitions, counting settings and reporting time zones aren't always identical. Google documents that its Analytics property time zone and Ads account time zone can create discrepancies.
Check whether one report's using conversion time while another's using interaction time. Check whether an Ads conversion action was imported from Analytics and whether the same event's also counted natively. Don't fix a reconciliation gap by multiplying a channel's attributed value until the numbers look aligned.
What does data-driven attribution tell you?#
Data-driven attribution estimates credit from observed converting and non-converting paths rather than a fixed 40/40/20 rule. Google describes machine learning that considers interaction order, timing, devices and creative factors. It's a useful operational estimate within its measurement scope, not a randomized experiment proving that every credited touch caused a sale.
Because a data-driven allocation isn't a public fixed formula, don't invent channel percentages for the hypothetical journey above. Compare the actual platform output with last click for the same conversion action and date range.
How should marketing ops implement a trustworthy model comparison?#
Marketing ops should implement model comparison by defining one conversion, collecting a consistent journey table, validating tracking handoffs and running each credit rule against the same eligible paths. A model switch won't repair missing form events or broken CRM associations.
The workflow should produce a reproducible table that Finance and RevOps can audit without relying on screenshots from several dashboards.
Lock the conversion and value
Choose a single event such as qualified demo, opportunity created or closed-won. Specify whether value means count, pipeline dollars or booked revenue. Don't combine them in one allocation.
Define the eligible path
Set identity level, event types, direct-traffic treatment, deduplication, time zone and lookback window. Freeze these rules for the comparison period.
Collect source events
Join campaign UTMs, GA4 events, form submissions and CRM stage changes. Preserve original event timestamps, source systems and ingestion timestamps.
Test the joins and gaps
Sample journeys across paid search, email, organic and offline handoffs. Confirm that forms create the intended CRM record and that duplicate contacts don't create duplicate opportunities.
Calculate models side by side
Apply first, last, linear and a selected milestone rule to identical eligible paths. For time decay, document the half-life. Reconcile each model's allocated total to the original conversion total.
Publish the decision log
Show which channels gained or lost credit, whether the movement changes a budget decision and which evidence remains missing. Record the model version and owner.
Which fields belong in the attribution journey table?#
An attribution journey table needs a stable conversion ID, timestamp, eligible channel, campaign identifier, event type, account or contact join key and source system. For revenue reporting it also needs the conversion value and the CRM milestone that establishes eligibility.
| Attribution journey field | Example | Validation rule |
|---|---|---|
conversion_id | opp_2048 | Unique at chosen conversion level |
event_time_utc | 2026-10-01T12:00:00Z | Normalized timestamp with source retained |
account_key | acct_581 | Stable across relevant contacts |
channel | paid_social | Approved taxonomy |
utm_campaign | fall_pipeline_webinar | Matches campaign register |
event_type | webinar_registration | Explicit eligibility rule |
milestone | lead_created | CRM state and timestamp verified |
value_usd | 20000 | Only on conversion record, not each touch |
source_system | crm | Audit provenance |
Don't place raw email addresses in an exported analyst workbook. Use approved pseudonymous keys and access controls. The goal's a reviewable join, not a second uncontrolled copy of contact data.
How do you validate the campaign-to-CRM handoff?#
Validate the campaign-to-CRM handoff with a test lead whose UTM values you can trace from landing page through form submission, contact creation and opportunity association. Check the actual field values at every boundary rather than assuming the integration succeeded.
A passing website tag doesn't prove that the CRM captured the campaign. A passing CRM workflow doesn't prove the form submitted the correct source. Use the campaign tracking checklist and UTM governance template to keep the naming and handoff tests repeatable.
- 01Campaign clickBreaks when UTM taxonomy and campaign ID
- 02Landing pageBreaks when Session and consent eligibility
- 03Form or eventBreaks when Key event and lead ID
- 04CRM opportunityBreaks when Account association and stage timestamp
- 05Attribution outputBreaks when Reconciled credit and model version
What data failures make attribution comparisons misleading?#
Attribution comparisons become misleading when events are missing, identity joins are wrong, campaign naming's inconsistent or different reports count different conversions. The most expensive mistakes often happen between tools, not inside the credit formula.
Which tracking problems should you check first?#
Check tracking problems in this order: missing key events, duplicate submissions, overwritten UTMs, direct-traffic handling, cross-domain journeys, consent gaps and CRM associations. A model can only allocate credit to the interactions that survive those steps.
- Missing event: a demo form succeeds visually but its key event never fires.
- Broken handoff: the contact exists in CRM, but its campaign source's blank or overwritten.
- Duplicate conversion: one form action creates multiple eligible records.
- Identity split: a buyer switches device or email and becomes two unrelated journeys.
- Offline omission: a sales call or event attendance isn't associated with the opportunity.
- Scope mismatch: one report counts lead creation while another counts closed-won revenue.
- Conversion ID is unique at the selected grain
- All model runs use the same eligible conversion set
- Campaign UTMs match the approved naming register
- Direct and unattributed paths follow one documented rule
- Lookback window and reporting time zone are recorded
- CRM lead and deal timestamps pass sample checks
- Each model's allocated credit reconciles to the source total
- Missing identity and consent coverage are disclosed
- No dashboard credits the same opportunity as additional revenue
Why do channel reports disagree after a model change?#
Channel reports disagree after a model change when their scope, date logic or event-level dimensions differ. In GA4, switching the reporting attribution model can change event-scoped key event credit without changing first-user or session-scoped acquisition dimensions.
Before escalating a discrepancy, write down the report name, conversion action, counting method, date basis, lookback and channel scope. Differences that don't go away after those controls deserve a source-event investigation, not a cosmetic spreadsheet adjustment.
How should you compare attribution with incrementality and marketing mix modeling?#
Attribution allocates observed conversions among eligible touchpoints, while incrementality experiments ask whether an intervention changed outcomes. Marketing mix modeling examines broader relationships between spend and results using aggregated time-series data. They're complementary lenses, not interchangeable answers.
A paid social campaign can receive substantial first-touch credit while producing little incremental lift in a holdout test. The first result describes a recorded path. The second tests a counterfactual under an experimental design. Use both before making a large channel cut.
For channels with weak click-level tracking, an aggregate test or geographic experiment may answer a budget question better than a more elaborate multi-touch model. Record the experiment's audience, dates, exclusions and primary outcome before launch. Don't retrofit the outcome after seeing the result.
How should you present attribution model comparisons to Finance?#
Present attribution model comparisons to Finance as a sensitivity analysis around one reconciled revenue or pipeline total. Show the credit swing by channel, the conversion definition and the data gaps that could change the recommendation.
A concise monthly decision memo can contain the source-of-truth opportunity count, model allocations, top channel changes, tracking exceptions and the proposed action. Keep the budget recommendation separate from the attribution output so a model assumption isn't mistaken for a financial fact.
A useful sentence is: Paid search receives more credit under last touch than under W-shaped attribution, but the underlying opportunity total's unchanged. We'd recommend holding spend steady until the lead-to-opportunity join's verified. That statement's more defensible than claiming a channel's return doubled because the credit rule changed.
The marketing operations audit checklist provides a broader control framework. The UTM naming convention keeps the acquisition labels consistent across campaigns.
The Marketing Ops Manager is a narrow campaign monitoring tool, not attribution software. It checks landing pages, tracking, forms, CRM connections and sales handoffs on a schedule and opens an incident with evidence when a step fails, which protects the inputs every model above depends on. It doesn't allocate credit, build reports or replace your analytics stack.
Frequently asked questions about marketing attribution models#
Marketing attribution model questions usually concern the best starting point, Google Analytics support and the difference between allocated credit and incremental impact. The answers hinge on which conversion you're measuring and which interactions you're able to observe.
Which marketing attribution model is most accurate?
No marketing attribution model is universally most accurate. A model can allocate observed credit consistently, but missing touchpoints and unclear conversion definitions limit every approach.
Is first-touch attribution available in GA4 in 2026?
First-touch attribution isn't an available GA4 reporting attribution model. Google removed first click, linear, time decay and position-based models from its native attribution choices in November 2023.
What's the difference between U-shaped and W-shaped attribution?
U-shaped attribution emphasizes first interaction and lead creation, while W-shaped also gives explicit weight to deal creation. Teams need reliable CRM milestone timestamps before using W-shaped reporting.
Does data-driven attribution prove a campaign caused a sale?
Data-driven attribution estimates credit from observed paths. It doesn't replace a randomized holdout or another credible incrementality design.
Should B2B teams use last-touch or multi-touch attribution?
B2B teams should keep last touch as a transparent baseline and add multi-touch views when they can reconstruct account journeys. Compare the same conversion set before you're changing budgets.